The **Trace Explorer** page lets you view aggregate latency trends,
filter Cloud Trace data, and inspect individual traces and spans to
troubleshoot performance bottlenecks and errors. By default, the
**Trace Explorer** page queries the trace data stored in your
Google Cloud project. However, you can configure the page to query
[trace data stored in multiple projects](https://docs.cloud.google.com/trace/docs/cross-project-traces.md.txt).
To perform a custom aggregate analysis of your spans using SQL, use the
**Observability Analytics** page or BigQuery. When you use the **Observability Analytics** page,
you can view query results as a table or as a chart. For information about using
SQL to query your trace data, see [Query and analyze traces](https://docs.cloud.google.com/trace/docs/analytics.md.txt).
## About the **Trace Explorer** page
To help you identify trends and patterns in your trace data, the latency data
is aggregated and displayed in charts. The heatmap uses color to represent
the number of spans in a cell. A cell with many spans has a darker color than
one with few spans. Each cell's tooltip displays latency and other information.
You can also view latency percentiles and span rate information.
The following screenshot illustrates how trace data is shown:

When you are investigating an issue, you might want to view a specific trace
or only spans with certain properties:
- To restrict which spans are shown, [apply filters](https://docs.cloud.google.com/trace/docs/finding-traces.md.txt#filter_traces). For
example, you can filter by service, application, error state, and other
properties.
- To display a specific trace, use the toolbar's
**Trace ID** option.
To identify outliers and view details of individual spans, use the tabular
section:
- You can sort the rows of the **Spans** and **Grouped** tabs by the duration
header.
- To understand how many spans different services are generating, use the
**Grouped** tab. Each row corresponds to a service and span name, and
for each entry, latency statistics are shown.
To explore details of a span or grouping, select the entry from a row in the
tabular section. A flyout opens that displays the span in the context of its
trace. From this view, you can explore the span, its attributes, and view events
and log data. You can also
[search the spans and attributes in the trace for keywords](https://docs.cloud.google.com/trace/docs/finding-traces.md.txt#search-trace).
The trace data that the **Trace Explorer** page displays depends on the
following:
- The **Scope** setting, which determines which views the system searches for
trace data. When the page opens, the **Scope** element is set to the default
[trace scope](https://docs.cloud.google.com/trace/docs/trace-scope/create-and-manage.md.txt) and the system queries the views listed
in that scope for trace data.
On a new project, the default trace scope lists the `_AllSpans`
view for the project. That view provides read access to all trace data that
the project stores.
You can create trace scopes that let you query data stored in
multiple projects. For more information, see
[View traces across projects](https://docs.cloud.google.com/trace/docs/cross-project-traces.md.txt).
- Your Identity and Access Management (IAM) permissions on the searched view.
If you don't have permission to view trace data for a project, then
the Google Cloud console displays a warning message and the data from that
project isn't displayed.
- The time-range setting.
- The filters you apply.
You can save your trace data on a custom dashboard. For more information, see
[Display trace data on a custom dashboard](https://docs.cloud.google.com/trace/docs/display-traces-on-dashboards.md.txt).
The remainder of this page provides more information about how to find and
explore your trace data.
## Before you begin
To get the permissions that
you need to view trace data by using the Google Cloud console and to select a trace scope,
ask your administrator to grant you the
[Cloud Trace User](https://docs.cloud.google.com/iam/docs/roles-permissions/cloudtrace.md.txt#cloudtrace.user) (`roles/cloudtrace.user`) IAM role on your project.
For more information about granting roles, see [Manage access to projects, folders, and organizations](https://docs.cloud.google.com/iam/docs/granting-changing-revoking-access.md.txt).
This predefined role contains
the permissions required to view trace data by using the Google Cloud console and to select a trace scope. To see the exact permissions that are
required, expand the **Required permissions** section:
#### Required permissions
The following permissions are required to view trace data by using the Google Cloud console and to select a trace scope:
- To select a trace scope: `cloudtrace.traceScopes.[get, list]`
- To read the default trace scope: `observability.scopes.get`
You might also be able to get
these permissions
with [custom roles](https://docs.cloud.google.com/iam/docs/creating-custom-roles.md.txt) or
other [predefined roles](https://docs.cloud.google.com/iam/docs/roles-overview.md.txt#predefined).
For more information about roles, see
[Control access with Identity and Access Management](https://docs.cloud.google.com/trace/docs/iam.md.txt).
## View aggregated trace data
To view the aggregated information about your trace data, do the following:
1. In the Google Cloud console, go to the

**Trace explorer** page:
[Go to **Trace explorer**](https://console.cloud.google.com/traces/explorer)
You can also find this page by using the search bar.
It might take several minutes after the first trace data is written
to a Google Cloud project before that data is available to view.
If you don't see any trace data displayed after waiting a few minutes, then
your project might not have any data to display or there might be a
configuration issue. For information about how to resolve these issues, see
[Troubleshoot: No data in the Trace interface](https://docs.cloud.google.com/trace/docs/troubleshooting.md.txt#no-data-refresh).
2. Configure the **Trace Explorer** page:
1. In the toolbar of the Google Cloud console, select your Google Cloud project. For [App Hub](https://docs.cloud.google.com/app-hub/docs/overview.md.txt) configurations, select the App Hub host project or management project.
2. Optional: Configure which views the system searches for trace data by using the **Scope** element:
- To show the trace data that your project stores, set the
first menu of the **Scope** element to
 **Project** or to  **_Default**.
These two settings are equivalent.
- To show the trace data that multiple projects store, expand the
first menu of the **Scope** element, select
**Trace scope** , and then select the trace scope that lists
the `_AllSpans` view for those projects.
After you make your selection, the **Scope** menu displays
a trace scope icon, , and the name of the
selected trace scope.
The data that the system displays depends on your
IAM roles on the searched views. For example, if you don't
have the permissions necessary to see data in a view,
then the system doesn't display that data.
For more information, see
[Create and manage trace scopes](https://docs.cloud.google.com/trace/docs/trace-scope/create-and-manage.md.txt).
3. Optional: Update the time range by using the time-range selector or by
using your pointer to highlight a range on the x-axis.
For example, you might set this selector to **Last 2 weeks** when you want
to see whether there are any trends in the latency data.
Span data is stored for 30 days.
3. Explore the heatmap:
- Use color to identify trends and outliers. A cell with many spans has a
darker color than one with few spans.
- View details of the cell by using the cell's tooltip. The tooltip lists
the number of spans, date and time, and the time interval of the cell.
> [!TIP]
> **Tip:** If you select a cell in the heatmap, then the table that lists individual spans or groupings of spans is updated.
4. Explore latency percentiles and error rates:
- To view latency trends, set the **Chart view** menu to
**Span duration (percentile)**.
The duration chart displays the 50th, 90th, 95th, and 99th percentiles.
- To view the response status as a function of time,
set the **Chart view** menu to **Span rate**. The chart displays the
rate of spans being sent to your project.
5. Use the **Spans** and **Grouped** tables to identify outliers or to view
statistical information. The **Spans** table lists individual spans. The
**Grouped** table groups spans by their name and by service or workload name.
- To view outliers or find a span name, sort the table. You can sort by
any column header.
For example, sorting the **Spans** table by duration lets you find
spans with high latency.
- To view statistics like average latency, use the **Grouped** table.
- To find App Hub-registered services and workloads, search
the **Service/workload** column for entries that include the
service icon, , or the
workload icon, .
The link provided with an App Hub-registered
service or workload opens the corresponding Application Monitoring dashboard.
If you want more information about a particular grouping, then select the
span name for a row. A flyout opens that displays the span in the context of
its trace. You can then [explore the span and trace](https://docs.cloud.google.com/trace/docs/finding-traces.md.txt#explore).
6. To restrict which spans are shown, add filters.
For information about filtering your trace data, see the next section.
## Filter your trace data
To display only information that is of interest to you, apply filters.
Filters restrict what data is shown. For example, you might
filter by service name and by status. Or, if you've deployed applications
to [App Hub](https://docs.cloud.google.com/app-hub/docs/overview.md.txt), you might want to view the trace data
only for the application, or for a specific service or workload that is part
of the application.
When you add or remove a filter, the data displayed by the
**Trace Explorer** page is refreshed and
only shows those spans that match all applied filters.
### Filter by trace ID
When you are troubleshooting an incident or failure, you might know the
trace ID. To explore that trace, go to the toolbar,
click **Trace ID** ,
and enter the [trace ID](https://docs.cloud.google.com/trace/docs/reference/v1/rest/v1/projects.traces.md.txt#Trace).
> [!TIP]
> **Tip:** If you enter a valid trace ID but the result is empty, then the trace might be stored in a project that isn't being searched. To resolve this failure, identify the project that stores the trace and then update the **Scope** setting.
When you enter a valid ID, the **Details** flyout opens and displays
information about the trace and its spans. You can use the options in that
pane to explore the trace. For example, you might
[search the spans for keywords](https://docs.cloud.google.com/trace/docs/finding-traces.md.txt#search-trace).
If you enter a trace ID that isn't found, then the trace data might be
stored in a view that isn't searched by the
**Trace Explorer** page,
or you might not have an IAM role that lets you
view trace data. To resolve these failures, identify the projects that
store the trace data. For each project, verify that your
IAM role lets you view trace data and then ensure that the
**Scope** element lists the project's default view for trace data.
For more information, see
[Configure which views the **Trace Explorer** searches](https://docs.cloud.google.com/trace/docs/finding-traces.md.txt#refine-scope).
### Apply span filters
The **Span filters** pane lists the most common filters. You can select
multiple entries from any subcategory. As you add or remove filters,
the **Filter** bar is also updated.
The values for all menus are derived from your trace data. When a menu includes
an option without any text, that option refers to spans that don't
include the corresponding attribute.
The following **Span filters** are typically available:
- **OpenTelemetry service** : Filters by the `service.name` attribute.
- **Span name**: Name of the span.
- **Span status** : The request status. For information about the values, see the [OpenTelemetry SpanStatus documentation](https://opentelemetry.io/docs/concepts/signals/traces/#span-status).
- **Duration**: The duration of the span.
- **Span kind** : Describes the relationships between spans. For information about the values, see the [OpenTelemetry SpanKind documentation](https://opentelemetry.io/docs/concepts/signals/traces/#span-kind).
- **App Hub application** : Filters by the `gcp.apphub.application.id` resource attribute.
- **App Hub service** : Filters by the `gcp.apphub.service.id` resource attribute.
- **App Hub workload** : Filters by the `gcp.apphub.workload.id` resource attribute.
If you want to filter by an attribute that isn't listed in the
**Span filters** pane, then use the **Filter** bar.
### Use the filter bar
The **Filter** bar lets you apply a filter with a predefined filter key and
a value that you select, or you can enter both the key and value.
To add a filter, select **Add filter**, and then do one of the following:
- Select a defined key, like **Span name**, and then select a value from the secondary menu.
- Select **Add attribute filter**, and then add your custom key and value.
If you enter your own filter key, then use the same syntax as a key for an
attribute on a span.
For example, to filter by the host identifier, set the key to `host.id`.
Similarly, to filter by status code, set the key to `/http/status_code`.
In this scenario, you might set the value to `200`, which results in the
filter `/http/status_code: 200`.
To let the filter match any value, select **Any value**.
### Filter by application
You can filter your trace data by an [App Hub](https://docs.cloud.google.com/app-hub/docs/overview.md.txt) application,
workload, or service, when that data contains the following resource attributes:
- `gcp.apphub.application.{container,id,location}`
- `gcp.apphub.{workload,service}.{criticality_type,environment_type,id}`
These resource attributes are generated by
[instrumentation that you add to your applications](https://docs.cloud.google.com/monitoring/docs/instrument-for-application-monitoring.md.txt).
In the **Trace Explorer** page, use the following **Span filters**
menus to restrict spans by application, service, or workload:
- **App Hub application**
- **App Hub service**
- **App Hub workload**
To open the Application Monitoring dashboard for a
App Hub-registered service and workload, do the following:
1. Go to the **Spans** or **Grouped** table and find the service or
workload. You might look for the service icon, ,
the workload icon, , or filter the table.
2. Select the link in the **Service/workload** column.
## Explore a trace
To explore a span in the context of its trace, do the following:
1. Open and configure the **Trace Explorer** page. For information
about these steps, see [View aggregated trace data](https://docs.cloud.google.com/trace/docs/finding-traces.md.txt#view-recent).
2. To view details of a span or a trace, do one of the following:
- Go to the **Trace Explorer** page and select an entry from the
table. You can sort the rows of the tables by any table header. You can
[apply filters](https://docs.cloud.google.com/trace/docs/finding-traces.md.txt#filter_traces) to restrict which spans the tables show.
- Go to the toolbar of the **Trace Explorer** page, click
**Trace ID** , and enter the [trace
ID](https://docs.cloud.google.com/trace/docs/reference/v1/rest/v1/projects.traces#Trace).
The **Details** flyout opens and displays a trace and its spans in a
timeline format and displays information about the selected span:
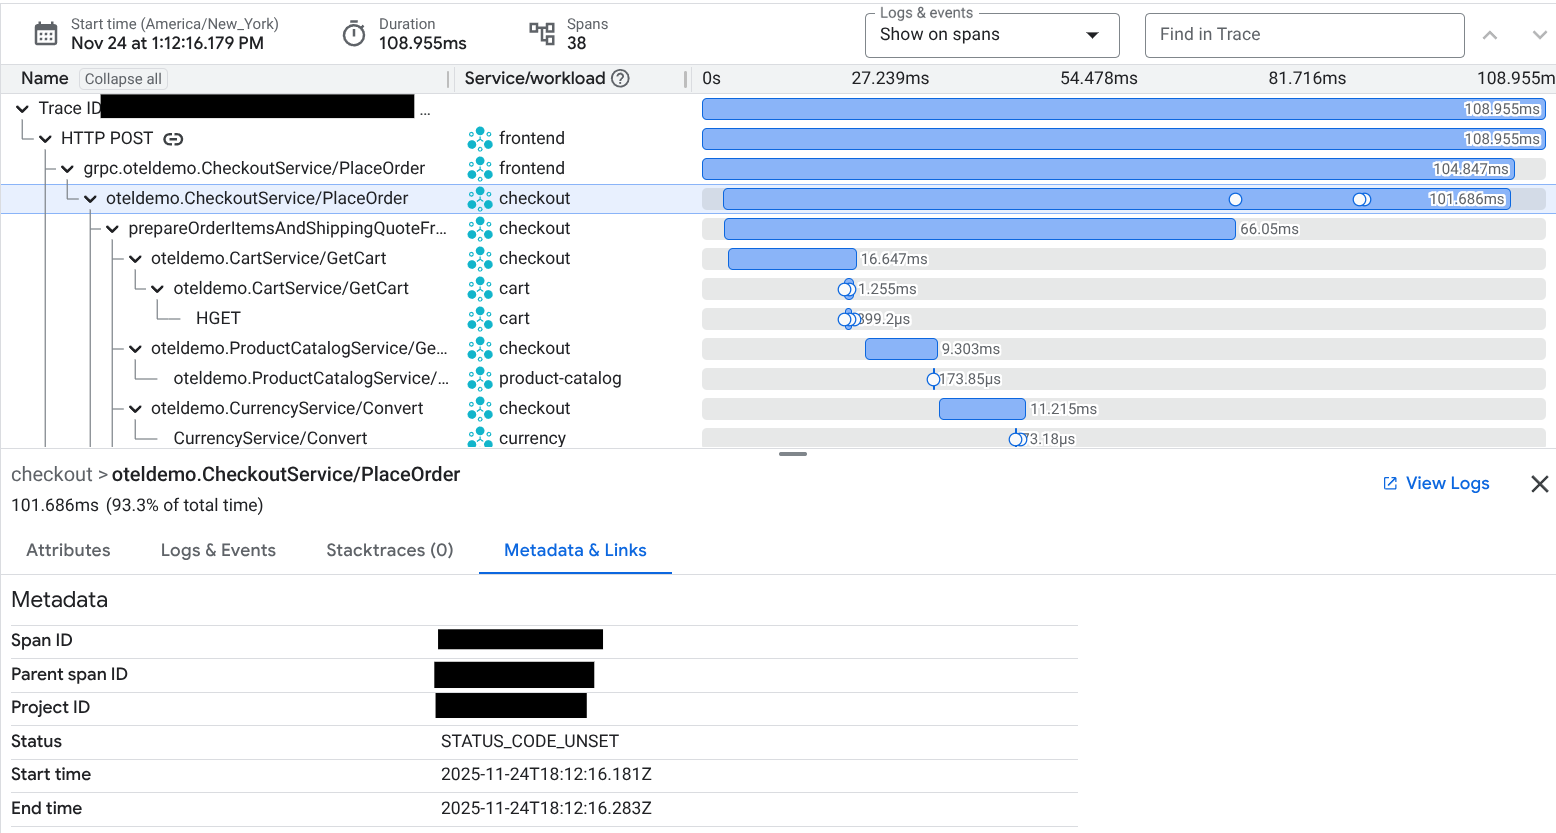
The flyout contains a split screen. One side displays the span in the
context of its trace. The other side displays tabs that let you view
span-specific information such as attributes, metadata, and attached
prompts and responses. For information about these tabs, see
[View attributes, log entries, and events](https://docs.cloud.google.com/trace/docs/finding-traces.md.txt#attributes-events).
The elements of the timeline are dynamic. Select a span to view its
[attributes, log entries, and events](https://docs.cloud.google.com/trace/docs/finding-traces.md.txt#attributes-events).
### Explore the call hierarchy
By default, the call hierarchy appears as a timeline. The first entry represents
the trace, and each subsequent entry represents a span. Each entry shows the
following:
- The **Name** column displays a name and a span or trace ID. A **GenAI** icon, , indicates that a span includes generative AI events or attributes.
- The **Service/workload** column displays a service or workload name. The system sets this value by using the OpenTelemetry attribute `service.name`. As a fallback, for App Engine services, the system displays the App Engine service name.
- The color and length of the latency bar reflect the command status and duration.
- A circle on a latency bar indicates that a log entry or event is associated with the span. To change this behavior, use the **Logs \& events** menu.
To view the call hierarchy as a directed acyclic graph (DAG), select **Graph**
in the toolbar:

In the DAG view, the name and latency appear with each element. Color reflects
the span's status. You can use the scroll wheel on your pointer to change the
graph size.
### Search the spans in a trace
To search the spans in the trace for keywords,
use the **Find in Trace** field.
Search applies only to the span name, service or workload name,
and attributes fields.
You can only search by plain text, and you can't search logs, events, or
metadata.
For example, if you enter `GET`, then any case-insensitive match for `GET` in
the **Name** , **Service/workload** , and **Attributes** fields is highlighted.
### View attributes, log entries, and events
The **Details** flyout for a span contains a tab for each of the following:
- **Inputs/Outputs** : Shows events that follow the
[OpenTelemetry GenAI semantic conventions](https://github.com/open-telemetry/semantic-conventions/tree/v1.37.0/docs/gen-ai). This tab is shown only when
the span contains these events. To help you identify these spans,
the timeline view displays a **GenAI** icon, , with
the span name, when the span contains events or attributes that follow those
conventions. For more information, see
[View generative AI events and attributes](https://docs.cloud.google.com/trace/docs/finding-traces.md.txt#generative-events).
- **Attributes** : Lists the attributes that are attached to spans.
Trace Explorer indicates which spans contain generative AI attributes
by displaying a **GenAI** icon, .
For information about labels, see [Trace labels](https://docs.cloud.google.com/trace/docs/trace-labels.md.txt).
- **Logs \& Events** : This tab lists events and log entries whose
`trace_id` and `span_id` fields match the selected span. Only
log entries that you have permission to view are shown.
To explore an entry on this tab,
click **Show more**.
If you prefer to use the Logs Explorer page to view log data, then
click **View logs**. The query is set to filter to a specific trace, span,
and time range.
> [!NOTE]
> **Note:** Generative AI events are shown on the **Inputs/Outputs** tab. For more information, see [View generative AI events](https://docs.cloud.google.com/trace/docs/finding-traces.md.txt#generative-events).
- **Stacktraces**: Lists the available stacktraces.
- **Metadata \& Links**: Lists general information, information about the
instrumentation scope, and links to the schema.
The **Metadata** section displays information such as the following:
- Span ID: The span ID is a 64-bit integer other than 0. For details, see [`TraceSpan`](https://docs.cloud.google.com/trace/docs/reference/v1/rest/v1/projects.traces.md.txt#TraceSpan).
- Parent span ID.
- Project ID.
- Start time and end time.
- Table that lists links to other spans. For each link, this table lists
the following:
- The key-value pairs for the linked-to span.
- The trace ID for the linked-to span. When this field lists **Current trace**, then the span is linking to another span in the same trace.
For information about links, see the
[`Links`](https://docs.cloud.google.com/trace/docs/reference/v2/rest/v2/Links.md.txt) API reference page.
The **Instrumentation scope** and **Schema information** sections display
the name and version of the scope, and they provide links to the schema.
These sections are omitted when a span doesn't contain this information.
The **Details** flyout might also include a tab labeled
**Inputs/Outputs**. This tab displays generative AI events.
### View generative AI events
To identify spans that contain attributes or events consistent with the
[OpenTelemetry GenAI semantic conventions](https://github.com/open-telemetry/semantic-conventions/tree/v1.37.0/docs/gen-ai), look for the **GenAI** icon,
:
- The **Attributes** tab displays attributes attached to the span. To list
only the generative AI attributes, enable **GenAI attributes only**.
- The **Inputs/Outputs** tab displays the events that follow
those conventions and the associated attributes, which are also shown on the
**Attributes** tab. There are two supported configurations:
- Text-based prompts and responses attached to spans as
[*attributes*](https://opentelemetry.io/docs/otel/common/#attribute), which are key-value pairs that describe
a characteristic or event. For example, the value for the key
`gen_ai.system` identifies the system that provides the generative AI
capabilities. The keys for generative AI attributes begin with `gen_ai`.
- Multimodal prompts and responses that are stored in a Cloud Storage
bucket. Cloud Trace identifies these events by correlating your trace
and log data. For information about supported configurations, see
[Collect and view multimodal prompts and responses](https://docs.cloud.google.com/trace/docs/collect-view-multimodal-prompts-responses.md.txt).
The following screenshot illustrates how the
**Inputs/Outputs** renders text-based generative AI
events attached to spans:

For information about the sample application that generated the previous
screenshot, see
[Instrument a LangGraph ReAct Agent with OpenTelemetry](https://docs.cloud.google.com/stackdriver/docs/instrumentation/ai-agent-langgraph.md.txt).
### View calls to remote MCP servers
To view spans generated by MCP servers, do one of the following:
- Filter your trace data by the span name.
- [Add an attribute filter](https://docs.cloud.google.com/trace/docs/finding-traces.md.txt#use-filter-bar) whose key is
`mcp.method.name` and whose value is `tools/call`.
This filter is specific to finding spans whose name follows the
[OpenTelemetry Semantic Conventions for MCP](https://opentelemetry.io/docs/specs/semconv/gen-ai/mcp). The name is similar to:
tools/call NAME
In the previous expression, NAME refers to the invoked endpoint.
For example, this might be something similar to `roll_dice`.
For information about the Google Cloud MCP servers that generate traces and
how to configure your application to instruct MCP servers to generate spans,
see [Investigate MCP calls using Trace](https://docs.cloud.google.com/trace/docs/trace-remote-mcp-server-calls.md.txt).
## What's next
- [Display trace data on a custom dashboard](https://docs.cloud.google.com/trace/docs/display-traces-on-dashboards.md.txt)
- [Create and manage trace scopes](https://docs.cloud.google.com/trace/docs/trace-scope/create-and-manage.md.txt)
- [Share traces and spans](https://docs.cloud.google.com/trace/docs/share-trace-or-span.md.txt)
- [Troubleshoot](https://docs.cloud.google.com/trace/docs/troubleshooting.md.txt)