The **Metrics Management** page in Cloud Monitoring lets you analyze ingestion
volume, query activity, and costs for all billable metrics visible to your
Google Cloud project's [metrics scope](https://docs.cloud.google.com/monitoring/settings). You can use this
page to identify unused high-cost metrics, create exclusion rules to stop
ingesting unneeded metrics, add dashboards or alerting policies for unmonitored
metrics, and troubleshoot metric-write or cardinality issues.
The **Metrics Management** page doesn't report user-defined
[log-based metrics](https://docs.cloud.google.com/logging/docs/logs-based-metrics), which have the prefix `logging.googleapis.com/user`
and are derived by counting values in log entries.
## Capabilities of the **Metrics Management** page
You can use the **Metrics Management** page to do the following:
- **View metric usage at a glance** : See how your metrics are being used
in [queries](https://docs.cloud.google.com/monitoring/docs/metrics-management#metric-read-sources), [custom dashboards](https://docs.cloud.google.com/monitoring/docs/metrics-management#quick-filters), or
[alerting policies](https://docs.cloud.google.com/monitoring/docs/metrics-management#quick-filters).
- *Unused billable metrics* are active metrics that have not been queried in the last 30 days and are not used in a custom dashboard or alerting policy.
- To view alerting policies or custom dashboards for a metric in your metrics scope but defined in a different project, use the project picker to select the Google Cloud project that stores the metric.
- **Identify high-cost, low-value metrics** : Filter and sort metrics to see
which unused billable metrics are contributing the most to your bill. See which
[projects](https://docs.cloud.google.com/monitoring/docs/metrics-management#extended-table) and namespaces are responsible for expensive
metrics.
- [View trends over time](https://docs.cloud.google.com/monitoring/docs/metrics-management#view-history) to understand the relative costs of your billable metrics.
- [Set up alerts](https://docs.cloud.google.com/monitoring/docs/metrics-management#create-alert) to notify you if your overall usage patterns change.
- For information about how billable metrics are billed, see [Pricing models for billable metrics](https://docs.cloud.google.com/monitoring/docs/metrics-management#chargeable-metrics).
- **Manage costs** : [Create rules to exclude unneeded
metrics](https://docs.cloud.google.com/monitoring/docs/metrics-management#exclude-metrics) from being ingested into Cloud Monitoring.
Excluded metrics are not billed. Exclusion rules apply regardless of the
source of the metric.
- Exclude single metrics by using the metric name.
- Exclude groups of metrics by using a regular expression.
- **Make use of valuable metrics** : Create
[alerting policies](https://docs.cloud.google.com/monitoring/docs/metrics-management#create-metric-ap) and [dashboards](https://docs.cloud.google.com/monitoring/docs/metrics-management#create-metric-db)
for unused billable metrics.
- **Troubleshoot metric-ingestion problems**:
- Troubleshoot [errors in writing metric data](https://docs.cloud.google.com/monitoring/docs/metrics-management#metric-write-errors).
- Identify possible problems with the [cardinality of billable metrics](https://docs.cloud.google.com/monitoring/docs/metrics-management#extended-table).
- View [audit logs associated with the collection of billable
metrics](https://docs.cloud.google.com/monitoring/docs/metrics-management#more-info). For general information about audit logs, see the [Cloud Audit Logs overview](https://docs.cloud.google.com/logging/docs/audit).
## Before you begin
To view the charts and logs included on the **Metrics Management** page,
to create alerting policies, and to create metric-exclusion rules, you must
have the correct [authorization](https://docs.cloud.google.com/monitoring/docs/metrics-management#authz).
The **Metrics Management** page analyzes metrics in terms of data collection and usage.
For more information about these categories, see [Terminology](https://docs.cloud.google.com/monitoring/docs/metrics-management#terminology).
### Authorization
-
To get the permissions that
you need to view dashboards and create alerting policies by using the Google Cloud console, or create, edit, and delete metric-exclusion rules,
ask your administrator to grant you the
[Monitoring Editor](https://docs.cloud.google.com/iam/docs/roles-permissions/monitoring#monitoring.editor) (`roles/monitoring.editor`) IAM role on your project.
For more information about granting roles, see [Manage access to projects, folders, and organizations](https://docs.cloud.google.com/iam/docs/granting-changing-revoking-access).
You might also be able to get
the required permissions through [custom
roles](https://docs.cloud.google.com/iam/docs/creating-custom-roles) or other [predefined
roles](https://docs.cloud.google.com/iam/docs/roles-overview#predefined).
-
To get the permissions that
you need to view audit logs,
ask your administrator to grant you the
[Private Logs Viewer](https://docs.cloud.google.com/iam/docs/roles-permissions/logging#logging.privateLogViewer) (`roles/logging.privateLogViewer`) IAM role on your project.
For more information about granting roles, see [Manage access to projects, folders, and organizations](https://docs.cloud.google.com/iam/docs/granting-changing-revoking-access).
You might also be able to get
the required permissions through [custom
roles](https://docs.cloud.google.com/iam/docs/creating-custom-roles) or other [predefined
roles](https://docs.cloud.google.com/iam/docs/roles-overview#predefined).
For more information about roles, see
[Control access with Identity and Access Management](https://docs.cloud.google.com/monitoring/access-control).
- To view the audit logs generated by the metrics on the
**Metrics Management** page, you must have enabled audit logging in your
Google Cloud project. To enable your project to generate audit logs when
data is read or written, do the following:
1. In the Google Cloud console, go to the **Audit Logs** page:
[Go to **Audit Logs**](https://console.cloud.google.com/iam-admin/audit)
If you use the search bar to find this page, then select the result whose subheading is
**IAM \& Admin**.
2. Enter **Stackdriver Monitoring API** on the filter bar.
3. Select **Stackdriver Monitoring API**.
4. In the **Log type** tab, select **Data write** and **Data read** , and then click **Save**.
For more information, see [Configure Data Access audit logs](https://docs.cloud.google.com/logging/docs/audit/configure-data-access).
### Terminology
The **Metrics Management** page uses the following terminology to describe the
status of metrics and to describe how you are using the metrics:
- Status of the metrics
- **Active metrics** are billable metrics from which your project has ingested data in the last 25 hours. These metrics incur costs.
- **Inactive metrics** are billable metrics from which your project hasn't ingested data in the last 25 hours. These metrics don't incur costs.
- Usage of the metrics
- **Used metrics** are metrics that have been queried in the
last 30 days by the Cloud Monitoring API or other tools, or that are used
in a custom dashboard or alerting policy.
It is possible to have charts and alerting policies that refer to metrics
with no data (inactive metrics) and to query such metrics; on the
**Metrics Management** page, these metrics are considered used metrics,
even though any read operations return no data.
- **Unused billable metrics** are active metrics that have not been
queried in the last 30 days and are not used in a custom dashboard or
alerting policy. These metrics incur ingestion costs but are not providing
observability benefits. If these metrics represent observability
gaps, you can create charts or alerting policies for them. If these
metrics don't represent observability gaps, then you can exclude them
and eliminate the cost of ingesting them.
- **Idle metrics** are inactive metrics that have not been queried
in the last 30 days and are not used in a custom dashboard or alerting
policy. These metrics don't incur costs.
The usage status for metrics is computed every 24 hours, to reflect the
most recent query history and changes to dashboards and alerting policies.
## View summaries of metric usage
To view summaries of the number of billable metrics, rates of metric
ingestion, and error rate, do the following:
1. In the Google Cloud console, go to the
**Metrics management** page:
[Go to **Metrics management**](https://console.cloud.google.com/monitoring/metrics-management)
If you use the search bar to find this page, then select the result whose subheading is
**Monitoring**.
2. In the toolbar, select your time window. By default, the **Metrics Management**
page displays information about the metrics collected in the previous
day. The following screenshot shows an example:

- To see a summary of how many billable metrics are currently
active in the projects in your metrics scope, refer to the
**Active Metrics** scorecard. A metric is active if data has been
written to it in the last 25 hours.
- To determine how many of the active billable metrics are being
queried or used in charts or alerting policies, refer to the **Metric
Usage** scorecard. Unused billable metrics represent possible observability
gaps that might be filled by creating custom dashboards or alerting
policies, or opportunities to reduce costs by excluding the metric
entirely.
- To determine what is contributing to your costs, use the
**Billable bytes ingested** and **Billable samples ingested** scorecards.
For more information, see [View overall trends in metric
ingestion](https://docs.cloud.google.com/monitoring/docs/metrics-management#view-history).
- To find information that might help you identify problems with the
design or usage of your billable metrics, use the **Metric Write
Errors** scorecard. For more information, see
[Investigate problems with your metrics](https://docs.cloud.google.com/monitoring/docs/metrics-management#diagnostics).
The **Metrics Management** page shows you the amount of data you are ingesting,
not actual costs. To view current billing information, click **View Billing**
in the toolbar.
## View information about your metrics scope
The set of metrics displayed in the **Metrics Management** page depends on the
metrics scope of your project. If your project has only itself in its
metrics scope, then the metrics on the **Metrics Management** page are
from the current project. If your project has multiple projects in its
metrics scope, then the metrics shown on the **Metrics Management** page
include the metrics from all of those projects. It might be that the metric
contributing the most to your cost originates in a different project.
To view a summary of the scoping information for your project,
click **Metrics scope**. This summary includes the following:
- IAM principals with access to the project. The set of principals includes users, groups, and service accounts.
- The number of both free and billable metrics that are visible to the metrics scope.
- A list of the projects that are monitored by the current project. The billable metrics from all these projects are available on the **Metrics Management** page.
- Information about any projects that can view the metrics of the current project.
For more information about metrics scopes, see [Configure a multi-project
view](https://docs.cloud.google.com/monitoring/settings).
## Investigate your billable metrics
The **Metrics Management** page provides a table that includes each billable
metric in your metrics scope. You can use this table to do the following:
- Determine any metric's contribution to billable volume.
- Determine how often a metric has been read in the last 30 days. Metric reads include API read requests and requests generated by charts.
- Identify metrics that are collected but not used in any alerting policy or dashboard. Metric data that is not used might represent a gap in observability or an opportunity for cost saving by excluding the metric.
- Create an alerting policy or chart for metrics that don't have an associated alerting policy or custom dashboard.
- Identify the project in which metric data originated. The table includes metrics from all the projects in your metrics scope, and you might need to know which project a particular metric is collected from.
- Review label and cardinality information about each metric. This information can be helpful when you are [investigating problems](https://docs.cloud.google.com/monitoring/docs/metrics-management#diagnostics) with metric design or usage.
To view the table of usage data for each billable metric, do the
following:
1. In the Google Cloud console, go to the
**Metrics management** page:
[Go to **Metrics management**](https://console.cloud.google.com/monitoring/metrics-management)
If you use the search bar to find this page, then select the result whose subheading is
**Monitoring**.
2. In the toolbar, select your time window. By default, the **Metrics Management**
page displays information about the metrics collected in the previous
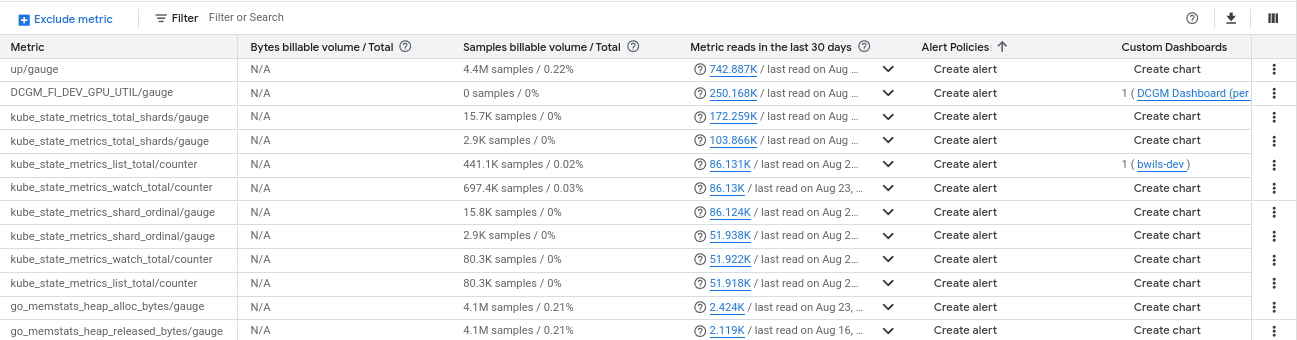
day. The following screenshot shows an example of the metrics table:
### Select the metrics to view
To manage your costs, you need to understand which billable metrics are
generating the most traffic. It isn't sufficient to only know, for example,
that 60 MiB of data is being ingested every hour.
However, when you know that most of your billable data is due to one or
two metrics, you can investigate the usage of those metrics.
To list your billable metrics, do the following:
1. In the Google Cloud console, go to the
**Metrics management** page:
[Go to **Metrics management**](https://console.cloud.google.com/monitoring/metrics-management)
If you use the search bar to find this page, then select the result whose subheading is
**Monitoring**.
2. In the toolbar, select your time window. By default, this tab displays information about the metrics collected in the previous day.
3. To limit the display to specific groups of metrics, [use the quick
filters](https://docs.cloud.google.com/monitoring/docs/metrics-management#quick-filters) or [filter the table directly](https://docs.cloud.google.com/monitoring/docs/metrics-management#manual-filters). Looking at categories of metrics might reveal patterns that are hard to detect when looking at all the metrics in the table.
The metrics table lists the billable metrics that are in the
metrics scope of the current Google Cloud project. For each metric, the table
displays that metric's contribution to billable volume and provides links to
the alerting policies and custom dashboards associated with the metric,
as shown in the following screenshot. If there is no alerting policy or
dashboard associated with a metric, the table includes a button you can click
to create one.

To sort metrics by their contribution to billable volume, click the
column header for **Bytes billable volume/Total** and **Samples billable
volume/Total**.
The metrics table also shows the domain of the metric, the set of labels for the metric, the project from which the metric was ingested, and the cardinality of the metric. The following screenshot shows an example of these columns.

The label and cardinality information might be useful in identifying
the cause of increases in billable volume. In Cloud Monitoring, *cardinality*
refers to the number of time series associated with a metric and a resource, and is
related to the labels and their values; there is one time series for each
combination of label values. For more information, see
[Cardinality](https://docs.cloud.google.com/monitoring/api/v3/metric-model#cardinality).
Changes in billable volume mean you are ingesting more data, and if the
changes are sudden or unexpected, the cause might be a change in the
number of labels associated with a metric or a change in the way
the values for the labels are set. Either of these can increase the cardinality
of a metric, with the result of a higher billable volume. For information
about using the **Metrics Management** to help identify problems with metrics,
see [Investigate problems with your metrics](https://docs.cloud.google.com/monitoring/docs/metrics-management#diagnostics).
#### Use quick filters
To view only the metrics in the following groups, select an entry on the
**Quick filters** pane:
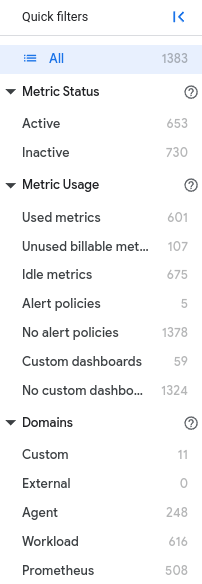
- Metric status includes active and inactive metrics. Active metrics have
ingested time-series data in the last 25
hours. For more information about these statuses, see
[Terminology](https://docs.cloud.google.com/monitoring/docs/metrics-management#terminology).
- Metric usage. This category classifies metrics by the following:
- Used, unused, and inactive metrics.
- Used metrics have been accessed by a metric read or are used in a custom dashboard or alerting policy.
- Unused billable metrics haven't been accessed by a metric read and aren't used in a custom dashboard or alerting policy.
- Idle metrics are both "inactive" and "unused".
For more information about these usage categories, see
[Terminology](https://docs.cloud.google.com/monitoring/docs/metrics-management#terminology).
- Metrics used or not used in an alerting policy
in the current Google Cloud project.
- Metrics used or not used in a custom dashboard
in the current Google Cloud project. These filters don't include metrics that
are used in predefined dashboards provided by Cloud Monitoring.
The usage status for metrics is computed every 24 hours, to reflect the
most recent query history and changes to dashboards and alerting policies.
- Sets of metrics by domain, as described in [summary of billable
metrics](https://docs.cloud.google.com/monitoring/docs/metrics-management#metric-summary).
If you have metrics that aren't used in an alerting policy or a
custom dashboard and are never queried, then you might be paying for metrics
and not be getting any observability benefit from them. You can list metrics
that appear in no alerting policy or in no custom dashboard defined in the
current Google Cloud project by selecting the **No alert policies** or **No custom
dashboards** quick filter.
> [!NOTE]
> **Note:** The **Metrics Management** page lists only alerting policies and custom dashboards defined in the current project; metrics listed with no alerting policies or custom dashboards might have alerting policies or custom dashboards in another project in your metrics scope. The metrics table includes the project ID for each metric, so you can identify those projects. To view alerting policies or custom dashboards defined in a different project, use the project picker to select the Google Cloud project that stores the metric.
#### Filter the table directly
You can use the **Filter** bar to search the
set of metrics when there is no suitable quick filter.
For example, if you have a multi-project metrics scope and you
want to list only the metrics from a single project, then you
can't use a quick filter. To list only the metrics from a specific
project, select `Project` from the filter list and enter the identifier
of a project.
You can also use explicit filters to search for metrics that match combinations
of filters. You can only select one quick filter at a time, so you can't list
only active metrics that appear in neither an alerting policy nor a custom
dashboard by using quick filters. To search for metrics that match a
combination of requirements, add filters to the filter bar. For example, to
list active metrics that appear in no alerting policies and
in no custom dashboards, add the following filters to the filter bar:
- `Status: Active`
- `Alert Policies: (Empty)`
- `Custom Dashboards: (Empty)`
By default, when you add multiple filters, the table includes a row
when the row meets all filters. However, you can insert an `OR`-filter
between two other filter elements.
### View information about metric reads
The row for each metric in the table includes an entry for the number
of metric reads in the last 30 days. You can use this entry to identify
how the queries were made. The query sources are categorized as "console" or
"other". Reads from Metrics Explorer or charts on custom dashboards are
"console" reads, and API reads from other sources are "other".
- To see a compact summary of the sources of metric reads, click the **Down arrow** next to the entry.
- To view a chart showing the sources of metric reads over time, click the number of metric reads. This value is also a link to the chart.
### Create an alerting policy for an unmonitored metric
When a metric in the table has no associated alerting policy, the table
provides a **Create alert** button. To create an alerting policy
for a metric, click **Create alert** in the row for the metric.
The alert policy dialog opens with the condition fields populated.
We recommend that you review all settings and make the following
modifications:
- Update the condition threshold value. The default value might not be satisfactory.
- Add the notification channels to the policy.
- Name the policy.
You can also create alerting policies for any metric by clicking
**Actions** and then clicking **Create alert
for metric**.
For more information, see [Create an alerting policy](https://docs.cloud.google.com/monitoring/alerts/using-alerting-ui#create-policy).
To view alerting policies for a metric in your metrics scope but
defined in a different project, use the project picker to select the
Google Cloud project that stores the metric.
### Create a chart for an unmonitored metric
When a metric in the table has no associated custom dashboard, the table
provides a **Create chart** button. You can use this button to create
a chart and place it on a custom dashboard. To create a chart
for a metric, do the following:
1. Click **Create chart** in the row for the metric.
The **Explorer** panel opens and is preconfigured to display the
selected metric. You can modify the chart configuration.
For more information about using Metrics Explorer,
see [Create charts with Metrics Explorer](https://docs.cloud.google.com/monitoring/charts/metrics-explorer).
2. To save the chart on a custom dashboard, click **Save as** , and select
**Dashboard chart**.
3. On the **Save to dashboard** dialog, do the following:
1. Accept or modify the default title for the chart.
2. Select the existing custom dashboard to which you want to save the chart, or select **New Dashboard** to create a new dashboard for the chart.
3. Click **Save to dashboard**.
To view custom dashboards for a metric in your metrics scope but
defined in a different project, use the project picker to select the
Google Cloud project that stores the metric.
### Work with metrics
While you can use the **Metrics Management** page to view some
information about a metric, you might want more information. For example,
you might want to view a chart of a specific metric or create an
alerting policy to notify you when that metric's ingestion rate is
unexpected.
To get more details about a specific metric, do the following:
1. In the Google Cloud console, go to the
**Metrics management** page:
[Go to **Metrics management**](https://console.cloud.google.com/monitoring/metrics-management)
If you use the search bar to find this page, then select the result whose subheading is
**Monitoring**.
2. Find the metric in the table, and then click **Actions** to do
any of the following:
- To view a chart that displays the current metric,
select **View in Metrics Explorer**.
Metrics Explorer opens and is preconfigured to display the
selected metric. You can modify the chart configuration, discard it,
or you can add it to a custom dashboard.
- To create an alerting policy that monitors the metric, select
**Create alert for metric**.
The alert policy dialog opens with the condition fields populated.
We recommend that you review all settings and make the following
modifications:
- Update the condition threshold value. The default value might not be satisfactory.
- Add the notification channels to the policy.
- Name the policy.
For more information, see [Create an alerting policy](https://docs.cloud.google.com/monitoring/alerts/using-alerting-ui#create-policy).
- Exclude the metric. For more information about this option, see
[Exclude unneeded metrics](https://docs.cloud.google.com/monitoring/docs/metrics-management#exclude-metrics).
- To view audit logs associated with the metric, select
**View metric audit logs**.
## Exclude unneeded metrics
> [!WARNING]
>
> **Preview**
>
>
> This product or feature is
>
> subject to the "Pre-GA Offerings Terms" in the General Service Terms section
> of the [Service Specific
> Terms](https://docs.cloud.google.com/terms/service-terms#1).
>
> Pre-GA products and features are available "as is" and might have limited support.
>
> For more information, see the
> [launch stage descriptions](https://cloud.google.com/products/#product-launch-stages).
You can create a metric-exclusion rule to prevent selected metrics
from being ingested into Cloud Monitoring. If, for example, you
have a set of unused billable metrics that you don't need, you can exclude
those metrics to eliminate the cost of ingesting them. You can later
[edit](https://docs.cloud.google.com/monitoring/docs/metrics-management#edit-exclusion) or [delete](https://docs.cloud.google.com/monitoring/docs/metrics-management#delete-exclusion) exclusion rules if
your needs change.
To create a metric-exclusion rule, do the following:
1. In the Google Cloud console, go to the
**Metrics management** page:
[Go to **Metrics management**](https://console.cloud.google.com/monitoring/metrics-management)
If you use the search bar to find this page, then select the result whose subheading is
**Monitoring**.
2. Click **Exclude metric** . You can also create exclusions from the **Excluded Metrics** tab or **Actions** in the row for each metric.
3. Select the metrics to exclude.
1. To exclude a single metric, select it from the **Metric name** table.
2. To exclude a group of metrics, do the following:
1. Click **Regex**.
2. Enter a regular expression. For example, to exclude all of the `agent.googleapis.com/apache` metrics, you can enter `agent.googleapis.com/apache.*` or `agent.*/apache.*`.
3. Click **Show matches** to verify that the expression matches the intended metrics.
3. Click **Create rule**.
It takes about 5 minutes for the rule to go into effect.
The following table includes regular expressions that might be useful
for excluding metrics from [`statsd`](https://github.com/statsd/statsd)
or similar dynamically named metrics:
| Block metrics with names containing | Regex |
|---|---|
| more than one underscore in a row | `.*_{2,}.*` |
| more than 7 digits in a row (likely timestamp) | `.*\d{7,}.*` |
| really long segments (likely label-parsing errors) | `.*[a-zA-Z0-9]{20,}.*` |
| hexadecimal substrings, including GUIDs | `.*[A-F0-9]{10,}.*` |
| IP-address substrings | `.*\d{1,3}_\d{1,3}_\d{1,3}_\d{1,3}.*` |
| any digit (might be useful for Prometheus metrics) | `.*\d+.*` |
| Prometheus metrics with an unknown type | `prometheus.googleapis.com/.+/unknown.*` |
### Edit a metric-exclusion rule
To edit a metric-exclusion rule, do the following:
1. In the Google Cloud console, go to the
**Metrics management** page:
[Go to **Metrics management**](https://console.cloud.google.com/monitoring/metrics-management)
If you use the search bar to find this page, then select the result whose subheading is
**Monitoring**.
2. Click the **Excluded Metrics** tab.
3. In the row for the rule you want to edit, click **Actions** and select **Edit rule**.
4. Clear the selected metric or the regular expression.
5. Select a new metric or create a new regular expression.
6. Click **Update rule**.
Editing a rule deletes the old rule and creates a new one.
> [!NOTE]
> **Note:** If an exclusion rule uses a regular expression that causes a time series without an existing metric descriptor to be excluded, the **Metric exclusion** table reports "undefined_metric" as the metric type.
### Delete a metric-exclusion rule
To delete a metric-exclusion rule, do the following:
1. In the Google Cloud console, go to the
**Metrics management** page:
[Go to **Metrics management**](https://console.cloud.google.com/monitoring/metrics-management)
If you use the search bar to find this page, then select the result whose subheading is
**Monitoring**.
2. Click the **Excluded Metrics** tab.
3. In the row for the rule you want to delete, click **Actions** and select **Delete rule**.
#### View the volume of excluded metrics
To see the volume of excluded bytes or samples as a chart in
Metrics Explorer, do the following:
1. In the Google Cloud console, go to the
**Metrics management** page:
[Go to **Metrics management**](https://console.cloud.google.com/monitoring/metrics-management)
If you use the search bar to find this page, then select the result whose subheading is
**Monitoring**.
2. Click the **Excluded Metrics** tab.
3. Click *history* **Exclusion timeline**.
The chart is pre-configured to display the metric-exclusion data for you.
You can also save the chart to a custom dashboard by clicking **Save to
dashboard**.
## View and alert on trends in billable metrics
The number of billable bytes and billable samples ingested determines the
majority of your costs. To predict your monthly costs due to use of
billable metrics, you need to know the rate of data ingestion. The
**Metrics Management** page provides summaries of metric usage, which can help
you do the following:
- View trends in your usage of billable metrics.
- Determine if a project in your metrics scope is sending more or less metric data than you expect.
- Identify the metrics that are generating the most data.
- Identify the namespaces that are responsible for generating the most Prometheus data.
- View the rate of write errors in your metrics. The error rate is the percentage of metric writes that return an error status relative to the total number of metric writes.
The [summary pane for metric usage](https://docs.cloud.google.com/monitoring/docs/metrics-management#view-summary-ingestion) provides
links to more detailed information about trends over time and links to
preconfigured, customizable alerting policies for usage trends.

### View overall trends in metric ingestion
To determine whether your applications are generating a consistent amount of
data, which is expected behavior for stable applications, view the collection
rates by using the ingestion scorecards. By changing the time window over which
you view metrics, you might see dips, peaks, or trends.
To view collection rates over time, do the following:
1. In the Google Cloud console, go to the
**Metrics management** page:
[Go to **Metrics management**](https://console.cloud.google.com/monitoring/metrics-management)
If you use the search bar to find this page, then select the result whose subheading is
**Monitoring**.
2. In the toolbar, select your time window.
3. Click **View charts** on the scorecard for bytes or samples ingested.
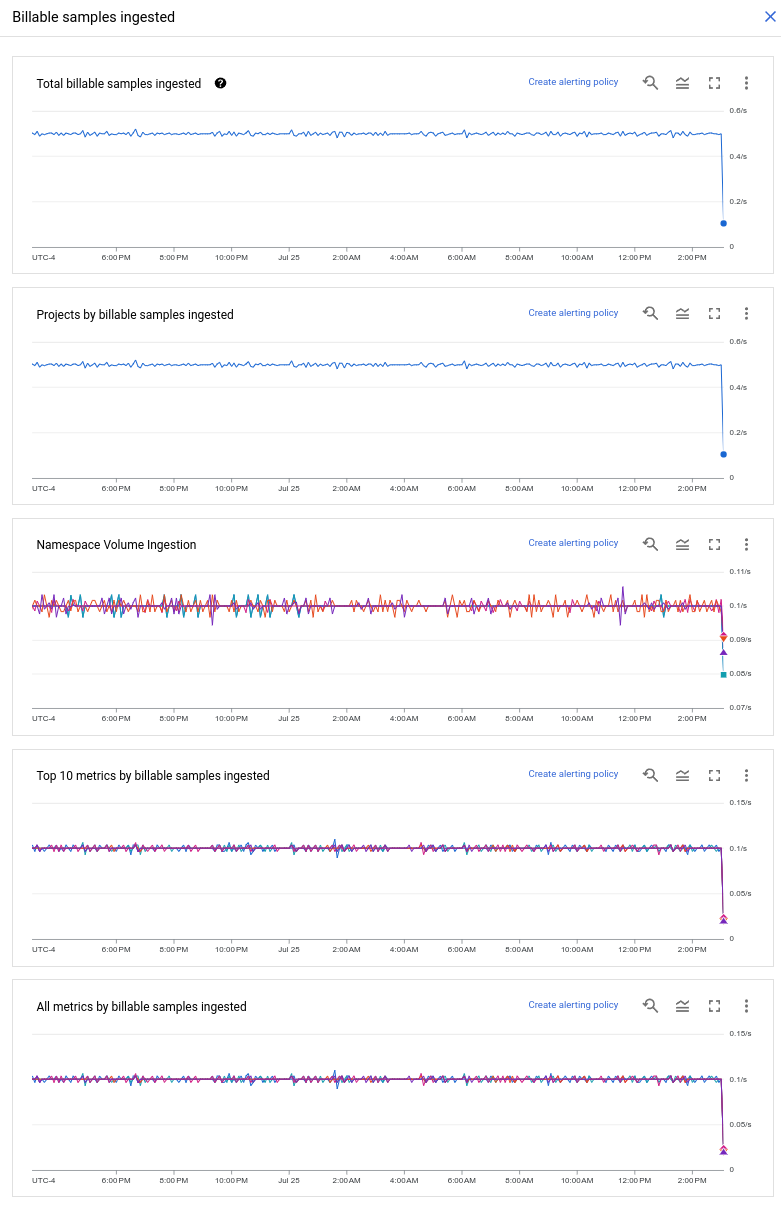
This discussion refers to charts for billable samples, but the charts
for billable bytes work the same way. You see a set of charts like
the following:
By default, chart legends are collapsed. To view the
list of time series shown in a chart,
click **Legend** . For information about how
to set time references or expand the chart over a specific
time window, see [Explore charted data](https://docs.cloud.google.com/monitoring/charts/working-with-charts).
> [!NOTE]
> **Note:** When a Google Cloud project isn't ingesting any billable metrics, these charts don't display data. Instead, the charts display "No data is available for the selected timeframe." This message isn't an error.
For example, if you set the time window to a week and you see a constant but
unexpected increase in the data ingested over time, then you might look to see
if the increase is coming from one specific metric or as a general trend across
a group of metrics. If one metric is responsible, then you could investigate
to see if the metric's [cardinality](https://docs.cloud.google.com/monitoring/api/v3/metric-model#cardinality) is also
increasing.
- To view the rate of billable samples ingested into the current
metrics scope, use the **Total billable samples ingested** chart.
- To view the contributions of each project in your metrics scope
to the total billable value, use the **Projects by billable samples
ingested** chart. This chart can tell you which projects are sending
the most data, and if any project is sending an increasing or
decreasing amount of data.
- (**Billable samples only** ) To find the namespaces that are sending
metrics with the largest contributions to the billable values,
use the **Namespace Volume Ingestion** chart.
- To view the metrics in your metrics scope with the largest
contributions to the billable values, use the **Top 10 metrics by
billable samples ingested** chart. You might look for spikes, dips, or
trends in the collection rates, or for a metric with a much different
line from all the others.
- To view the contributions to the billable value of all metrics in your
metrics scope, use the **All metrics by billable samples ingested**
chart. This chart includes the metrics in the **Top 10** chart and can
show you the overall distribution of collection rates from your metrics.
To analyze any of these charts in more detail, click
**More options** and select **View in
Metrics Explorer** . For examples that start with the
**Namespace Volume Ingestion** chart and use Metrics Explorer
to perform ingestion-volume attribution, see the following:
- [Identify high-volume metrics](https://docs.cloud.google.com/stackdriver/docs/managed-prometheus/cost-controls#high-volume-metrics)
- [Identify high-volume namespaces](https://docs.cloud.google.com/stackdriver/docs/managed-prometheus/cost-controls#high-volume-namespaces)
For more information about using Metrics Explorer to analyze data,
including actions like comparing the current month's behavior to the last
month's behavior, see [Explore charted data](https://docs.cloud.google.com/monitoring/charts/working-with-charts).
### Create alerts based on metric ingestion
To be notified of a spike, dip, or trend in the metric collection rates for your
billable metrics, create an alerting policy. For example, a dip in
collection of metrics might indicate that your application is performing poorly.
Similarly, a spike might result in unexpected charges. Lastly, an upward trend
might indicate that a metric has too many labels or is increasing in
[cardinality](https://docs.cloud.google.com/monitoring/api/v3/metric-model#cardinality). In all situations, an alerting policy
can notify you of the unusual behavior, and then you can resolve the situation.
If you have both metrics billed by bytes ingested and metrics billed by samples
ingested, you need to create an alerting policy for both billing values.
To create an alerting policy that monitors a metric collection rate, do
the following:
1. In the Google Cloud console, go to the
**Metrics management** page:
[Go to **Metrics management**](https://console.cloud.google.com/monitoring/metrics-management)
If you use the search bar to find this page, then select the result whose subheading is
**Monitoring**.
2. In the toolbar, select your time window.
3. Click **View charts** on the scorecard for bytes or samples ingested.
4. In the chart whose data you want to monitor, click
**Create alerting policy**.
The alert policy dialog opens with the condition fields populated.
We recommend that you review all settings and make the following
modifications:
- Update the condition threshold value. The default value might not be satisfactory.
- Add the notification channels to the policy.
- Name the policy.
For more information, see [Create an alerting policy](https://docs.cloud.google.com/monitoring/alerts/using-alerting-ui#create-policy).
## Investigate problems with your metrics
You can use the **Metrics Management** page to investigate problems with structure
or usage of your billable metrics. For example, you might be
experiencing the following:
- An increase in billable volume that can be attributed to a specific metric.
- Reports of increasing latency of queries for a specific metric.
- Errors in writing metric data, which might result from reaching limits on the amount or rate of data being written.
The occurrence of errors in writing metric data might correlate with
other problems like an unexpected increase in billable volume or increasing
query latency. For example, a change in the configuration of a metric might
result in a [cardinality](https://docs.cloud.google.com/monitoring/api/v3/metric-model#cardinality) problem, which can affect
both the volume of data ingested and query latency, and might also result in
metric-write errors.
### View metric-write errors
From the **Metric Write Errors** scorecard, you can do the following:
- View the status of metric-write requests.
- Create an alerting policy to notify you if the rate of metric-write errors exceeds a threshold value.
- View the audit logs for metric-write errors, if you have enabled audit logs. These logs can provide insight into the causes of the metric-write errors.
To view information about errors in writing metric data, do the following:
1. In the Google Cloud console, go to the
**Metrics management** page:
[Go to **Metrics management**](https://console.cloud.google.com/monitoring/metrics-management)
If you use the search bar to find this page, then select the result whose subheading is
**Monitoring**.
2. In the toolbar, select your time window.
3. Click **View errors** on the **Metric Write Errors** scorecard.
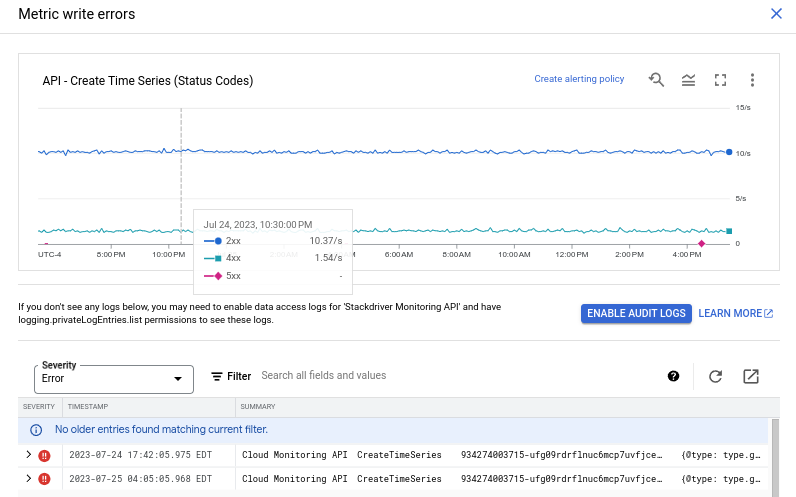
- To view the status of metric-write requests to the Cloud Monitoring API,
use the **API - Create Time Series (Status Codes)** chart.
This chart shows calls to the
[`timeSeries.create`](https://docs.cloud.google.com/monitoring/api/ref_v3/rest/v3/projects.timeSeries/create) method.
Each time series shows the rate of writes for a specific HTTP
status code. When the chart displays a single line for 2xx status
results, you have no metric-write errors. The following screenshot
shows both 2xx status results and a small number of 4xx and 5xx status
results:
If you see an increase in the number of metric-write requests, then you
might be seeing a [cardinality](https://docs.cloud.google.com/monitoring/api/v3/metric-model#cardinality) issue.
- If the chart displays status codes for errors, and if you have enabled
audit logs for your project, then you can use the logs to investigate
the causes of the errors. The preconfigured query for the logs looks
for errors associated with the Monitoring API method
[`timeSeries.create`](https://docs.cloud.google.com/monitoring/api/ref_v3/rest/v3/projects.timeSeries/create). This method is
called each time a metric is written.
Logs for `timeSeries.create` errors can tell you more about the
reason for error status codes. The method can fail if, for example,
you try to write too much data at once, or if you exceed a limit on
the number of active time series. For more information, see the
[User-defined-metrics](https://docs.cloud.google.com/monitoring/quotas#custom_metrics_quotas) section in the
Monitoring quotas document.
> [!NOTE]
> **Note:** The notice starting with "If you don't see any logs below" and the **Enable audit logs** button are always present, even when audit logs appear in the logs panel. The notice is a reminder that, if you don't see logs, then you might need to enable audit logging. If you see no logs, then it's possible that there are no logs to show.
### Investigate metric creation errors
Another method related to metrics that might fail is the
[`metricDescriptors.create`](https://docs.cloud.google.com/monitoring/api/ref_v3/rest/v3/projects.metricDescriptors/create) method.
The `metricDescriptors.create` method is called the first time you
write time-series data for a new metric, or if you change the structure
of the metric data, most likely by adding new labels. The audit
logs for errors from this method are available from the entry for
each metric in the metric table.
To view audit logs for a specific metric, do the following:
1. In the Google Cloud console, go to the
**Metrics management** page:
[Go to **Metrics management**](https://console.cloud.google.com/monitoring/metrics-management)
If you use the search bar to find this page, then select the result whose subheading is
**Monitoring**.
2. In the toolbar, select your time window.
3. Find the metric in the table, and then click **Actions**.
4. Select **View metric audit logs**.
The preconfigured query for the logs looks for errors associated with
the Monitoring API method
[`metricDescriptors.create`](https://docs.cloud.google.com/monitoring/api/ref_v3/rest/v3/projects.metricDescriptors/create).
Errors from the `metricDescriptors.create` method can help you identify possible
problems in the design of your metrics. You might see errors from this
method if you exceed the allowable number of metric descriptors or
the number of labels in a metric descriptor.
For more information, see the [User-defined-metrics](https://docs.cloud.google.com/monitoring/quotas#custom_metrics_quotas)
section in the Monitoring quotas document.
## Pricing models for billable metrics
In general, Cloud Monitoring system metrics are free, and metrics
from external systems or applications are not. Billable metrics are
billed by either the number of bytes or the number of samples ingested.
This section describes byte- and sample-based ingestion.
For detailed information about chargeable features in Cloud Monitoring, see
the Cloud Monitoring sections of the [Google Cloud Observability pricing](https://cloud.google.com/products/observability/pricing) page.
### Billing by bytes or samples ingested
Billable metrics are billed either by the number of bytes or by the number
of samples that are ingested. Each time a metric is written, the write operation
includes a data value. The data value can be a scalar, like an integer or a
floating-point number, or it can be a distribution, a complex data type
that includes several different values. For more information on the types
of values a metric might write, see [Value type](https://docs.cloud.google.com/monitoring/api/v3/kinds-and-types#value-types).
Both the frequency with which the metric is written---the *sampling
rate*---and the type of data the metric writes---scalars or
distributions---affect
the amount of data ingested, regardless of whether ingestion is charged by
bytes ingested or samples ingested.
- "Bytes ingested" means that charges are based on the volume of data ingested,
measured in bytes. For pricing purposes, each scalar value is counted as 8
bytes, and each distribution is counted as 80 bytes.
- "Samples ingested" means that charges are based on the number of measurements
ingested. For pricing purposes, each scalar value is counted as one sample,
and each distribution is counted as two samples plus one for each histogram
bucket that has a non-zero count.
The biggest difference between the two pricing models is for distribution
values. Byte-based ingestion charges a flat rate for distributions, but
sample-based ingestion takes into account the data in the distribution;
distributions with sparse histograms---few histogram buckets with non-zero
values---count as fewer samples than distributions with dense histograms,
in which most buckets have non-zero values.
### Billable metrics on the **Metrics Management** page
The **Metrics Management** page reports billable metrics by domain.
The domain gives you information about how the metric was collected and
from where.
The following table describes the categories of billable metrics
available on the **Metrics Management** page and whether they are measured by
bytes or samples ingested:
| Domain | Metric prefix | Pricing model | Meaning |
|---|---|---|---|
| Agent | `agent.googleapis.com` | Bytes | Metrics that are collected from external resources by [agents](https://docs.cloud.google.com/stackdriver/docs/solutions/agents). For lists of these metrics, see [Ops Agent metrics](https://docs.cloud.google.com/monitoring/api/metrics_opsagent) and [Legacy Monitoring and Logging metrics](https://docs.cloud.google.com/monitoring/api/metrics_agent). Metrics from third-party integrations that are collected by the legacy Monitoring agent are also reported as "agent" metrics; see [Agent metrics](https://docs.cloud.google.com/monitoring/api/metrics_agent#agent). The `agent.googleapis.com/processes/` metrics are charged at 5% of the volume rate of other chargeable metrics. For example, ingesting 100 MiB of process metrics costs the same as ingesting 5 MiB of other chargeable metrics. The agents also collect metrics about themselves. These metrics, identified by the prefix `agent.googleapis.com/agent`, aren't billable and don't appear on the **Metrics Management** page. |
| User-defined, custom | `custom.googleapis.com` | Bytes | Metrics that [you define](https://docs.cloud.google.com/monitoring/custom-metrics). |
| External | `external.googleapis.com` | Bytes | Metrics from some open source libraries or third-party providers. For more information, see [External metrics](https://docs.cloud.google.com/monitoring/api/metrics_other). |
| Workload | `workload.googleapis.com` | Bytes | Metrics from third-party integrations that are written by the [Ops Agent](https://docs.cloud.google.com/stackdriver/docs/solutions/agents/ops-agent). For a list of these metrics, see [Third-party application metrics](https://docs.cloud.google.com/monitoring/api/metrics_opsagent#3p). |
| Prometheus | `prometheus.googleapis.com` | Samples | Metrics collected by using [Google Cloud Managed Service for Prometheus](https://docs.cloud.google.com/stackdriver/docs/managed-prometheus), or by using the Ops Agent and the [Prometheus receiver](https://docs.cloud.google.com/monitoring/agent/ops-agent/prometheus) or the [OTLP receiver](https://docs.cloud.google.com/monitoring/agent/ops-agent/otlp). |
### Other billable metrics
The **Metrics Management** page does not report user-defined
[log-based metrics](https://docs.cloud.google.com/logging/docs/logs-based-metrics). These metrics, which are derived by
counting values in log entries, have the prefix `logging.googleapis.com/user`.
User-defined log-based metrics are charged by bytes ingested.
## What's next
- Use the Ops Agent to collect metrics:
- [Configure the Ops Agent](https://docs.cloud.google.com/monitoring/agent/ops-agent/configuration)
- [Monitor third-party applications](https://docs.cloud.google.com/monitoring/agent/ops-agent/third-party)
- [Collect Prometheus metrics](https://docs.cloud.google.com/monitoring/agent/ops-agent/prometheus)
- [Collect OTLP telemetry](https://docs.cloud.google.com/monitoring/agent/ops-agent/otlp)
- Use the Google Cloud Managed Service for Prometheus to collect metrics:
- [Use managed collection](https://docs.cloud.google.com/stackdriver/docs/managed-prometheus/setup-managed)
- [Use self-deployed collection](https://docs.cloud.google.com/stackdriver/docs/managed-prometheus/setup-unmanaged)
- [Use the OpenTelemetry Collector](https://docs.cloud.google.com/stackdriver/docs/managed-prometheus/setup-otel)
- [Use custom metrics in
Cloud Run](https://docs.cloud.google.com/run/docs/tutorials/custom-metrics-sidecar)
- Collect on-premises and hybrid-cloud metrics by using [BindPlane](https://docs.cloud.google.com/monitoring/bindplane/collecting-on-prem-hybrid)
- Create user-defined metrics by using [the Monitoring API](https://docs.cloud.google.com/monitoring/custom-metrics/creating-metrics)
- [Google Cloud Observability pricing](https://cloud.google.com/products/observability/pricing)