> [!NOTE]
> **Note:** If you're using classic Explores in Looker, see the [Classic Explore](https://docs.cloud.google.com/looker/docs/creating-visualizations-classic-explores.md.txt) documentation.
Looker lets you create charts and graphs from your query results to
visualize and present your data. Because Looker keeps your query
details and visualization configuration together, sharing a query gives
recipients both your visualization and the underlying data.
A *data series* is a set of related data points plotted on a chart, such as
daily order counts over a date range. Your chart type determines how each
series appears, such as same-color columns in a column chart or a single line
in a line chart. You can view and customize each series in the **Style** tab
of the [**Configure** panel](https://docs.cloud.google.com/looker/docs/viewing-and-interacting-with-explores.md.txt#navigating-the-explore-interface), and display series names in the chart legend.
This document is part of the
[Retrieve and chart data](https://docs.cloud.google.com/looker/docs/retrieve-and-chart-data.md.txt) learning
series.
## Quick guide
You can add an eye-catching visualization to any query result set on an Explore. Visualizations are displayed in the [**Visualization** pane](https://docs.cloud.google.com/looker/docs/viewing-and-interacting-with-explores.md.txt#navigating-the-explore-interface).
To change the visualization type in the new Explore experience, follow these steps:
1. Click the **Change chart** button to open the **All chart types** menu.
2. Choose a chart type from the menu. Alternatively, you can click **Auto visualize** to let Looker choose the best chart option for displaying the results.
The new chart type will display in the **Visualization** pane.
> [!NOTE]
> **Note:** When a query is running, the visualization pane displays the three phases of the query in the [Explore query tracker](https://docs.cloud.google.com/looker/docs/query-tracker.md.txt#explore_query_tracker).
## Navigating visualization settings in the Style tab
Once you have chosen a visualization type, you can use the [**Style** tab in the **Configure** panel](https://docs.cloud.google.com/looker/docs/creating-and-editing-explores.md.txt#navigating-the-configure-panel) to edit or configure the chart settings.
In the **Style** tab, the configuration options are organized into expandable sections.
To view the options in each section, click the section name. To collapse the section, click the section name again.
## Customizing visualizations with chart settings
You can customize a visualization to make your data more readable and to add visual styling. Select the **Style** tab in the **Configure** panel to see the edit options, and then change the settings to get a result that suits you.
Depending on the visualization type and query, the settings in the **Style** tab will change. To see the visualization options that are available for a particular visualization type, select that type on the [Visualization types](https://docs.cloud.google.com/looker/docs/visualization-types.md.txt) documentation page.
## Including multiple visualization types on a single chart
Charts can include multiple types of visualizations. For example, you can create a chart that uses both lines and columns.
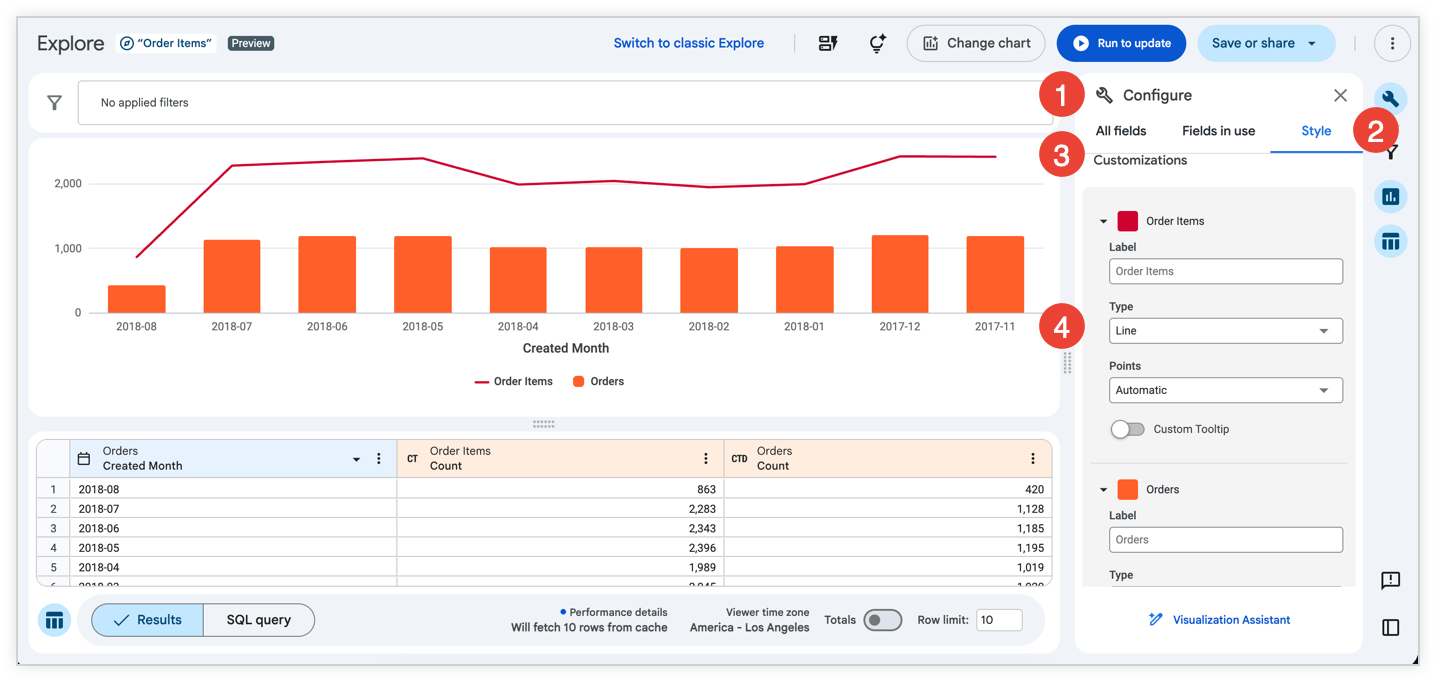
To create a chart that includes more than one visualization type, after you have created an initial visualization, follow these steps:
1. Open the **Style** tab in the **Configure** panel to show the customization options.
2. Expand the **Series** menu.
3. In the **Customizations** section, an entry appears for each series in the chart. Click the series name to expand its customization options.
4. In the **Type** menu, select the type of visualization to use for that series.
Charts with multiple series types always layer line series and scatter series in front of area, column, and bar series.
To alter the layering order of column, bar, and area series, change the series' positions in the data table and click the **Run to update** button. The leftmost series layers on top and the rightmost series layers on bottom.
## Creating stacked charts with multiple visualization types
You can include stacked series in a chart with multiple visualization types. For example, you can create a chart that uses lines with stacked columns. All series that have the same chart type set in the **Customizations** section of the **Series** menu as the chart type that is selected for the main Explore will stack together. Series that have different chart types set in the **Customizations** section of the **Series** menu won't stack.
For example, if you select a column chart as the Explore's chart type, all series that have a column chart set in the **Customizations** section of the **Series** menu will stack, but series that have a line chart set won't stack.
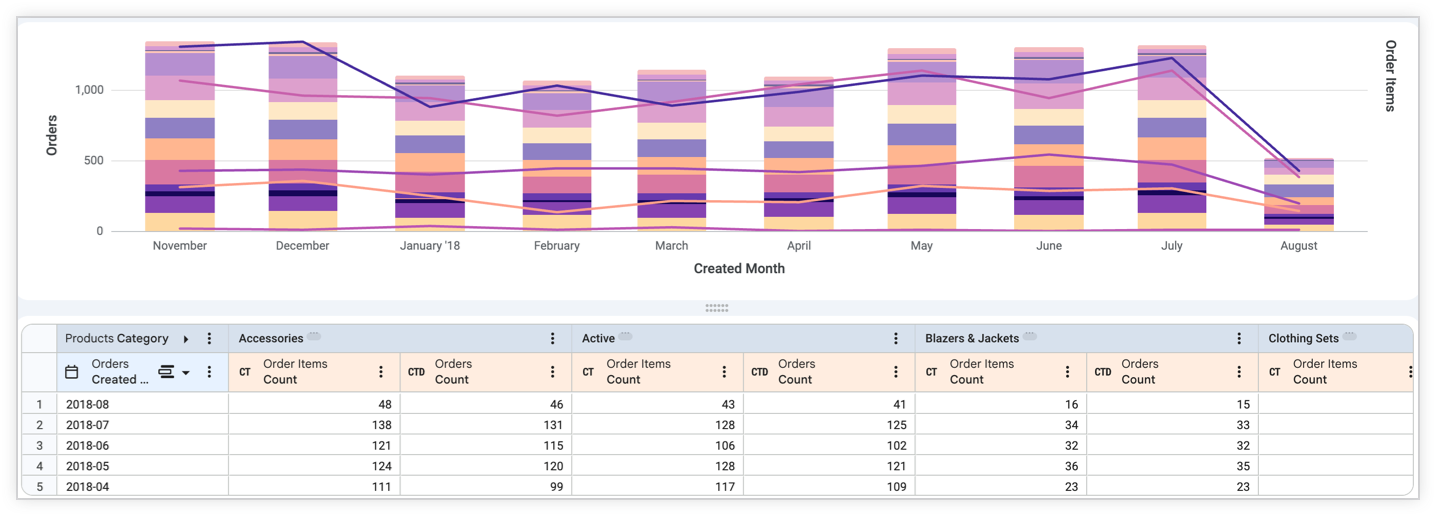
To create a stacked chart with multiple visualization types, follow these steps:
1. Create and run a query with multiple series. This can be done with multiple measures or with a [pivot](https://docs.cloud.google.com/looker/docs/creating-and-editing-explores.md.txt#pivoting_dimensions).
2. If a [Cartesian chart type](https://docs.cloud.google.com/looker/docs/visualization-types.md.txt#cartesian_charts) is not already selected for the Explore, select a Cartesian chart type in the [**Change chart** menu](https://docs.cloud.google.com/looker/docs/creating-visualizations.md.txt#quick_guide) (with the exception of boxplot or waterfall).
3. Open the **Style** tab in the **Configure** panel.
4. In the **Plot** menu, select the **Stacked** option in the **Series Positioning** section. This option stacks all series as the selected Cartesian chart type.
5. In the **Series** menu, under **Customizations**, expand the series for which you want to change the chart type.
6. For each series that you want to change, select an available chart type in the **Type** field. You can select different chart types for each series.
7. By default, all series are added to the left axis. If you want to use different y-axes for the stacked series and the other series, expand the **Y** menu, and drag the series that you want to change from the **Right Axes** sections to the **Left Axes** section. Alternatively, you can use multiple y-axes or x-axes.
## Hiding fields from visualizations
Looker adds all dimensions and measures that are returned by a query to any visualization. Sometimes, you might not want to display every dimension or measure in the chart. There are several methods to hide fields:
1. [Temporarily disable a field](https://docs.cloud.google.com/looker/docs/creating-visualizations.md.txt#temporary_hide) while viewing a visualization by using the visualization legend.
2. [Completely hide](https://docs.cloud.google.com/looker/docs/creating-visualizations.md.txt#hide) a field from the visualization by using the data column [**More** menu](https://docs.cloud.google.com/looker/docs/creating-and-editing-explores.md.txt#using-the-data-column-more-menu).
3. Allow a field to remain available to the visualization but [disable it by default](https://docs.cloud.google.com/looker/docs/creating-visualizations.md.txt#disable) in the visualization by editing the visualization
### Temporarily disabling a field from a visualization
When you're viewing a visualization, you can temporarily disable a series by clicking the series name in the visualization legend. The name of the series that you click will be grayed out in the legend, and the visualization will be updated to exclude that series's data from the visualization.
To unhide the series, click the name of the series in the legend again.
Using this method to hide the series is not permanent when viewing the visualization in a saved Look or a dashboard.
### Completely hiding a field from a visualization
> [!NOTE]
> **Note:** When you use this method to hide columns of data from a visualization, users who are viewing the visualization (such as on a dashboard) are unable to temporarily add the hidden data to the visualization. To let users temporarily add hidden data to a visualization, [disable the series by default](https://docs.cloud.google.com/looker/docs/creating-visualizations.md.txt#disable), as described in the next section.
To completely hide one or more fields from the visualization, follow these steps:
1. In the **Data** pane, select the [**More** menu](https://docs.cloud.google.com/looker/docs/creating-and-editing-explores.md.txt#using-the-data-column-more-menu) in the column for the series that you want to hide.
2. Select **Hide field from visualization**.
> [!IMPORTANT]
> **Important:** Looker doesn't re-run queries to exclude fields or values that are hidden using **Hide field from Visualization** . As a result, table calculations that are based on hidden fields may display unexpected results. To hide table calculations from a visualization, see the instructions on the [Using table calculations](https://docs.cloud.google.com/looker/docs/table-calculations.md.txt#using_table_calculations_in_visualizations) documentation page.
### Disabling a series by default in a visualization
To disable a series by default, follow these steps:
1. If the visualization is a saved Look or in a dashboard tile, enter Edit mode for the dashboard tile or Look.
2. In the visualization legend, click the name or names of the series that you want to disable. When disabled, the series color turns gray in the legend and the data disappears from the chart.
3. Save your edits to make the disabled state the default.
Viewers can select the series name in the legend to temporarily re-enable it.
### Hiding data in a pivoted visualization
When you're visualizing [pivoted Explore results](https://docs.cloud.google.com/looker/docs/creating-and-editing-explores.md.txt#pivoting_dimensions), a single field is split into multiple series.
Each series that is created from a pivoted field can be hidden individually using two of the same techniques that you can use on non-pivoted series, as follows:
- [Temporarily hiding the field](https://docs.cloud.google.com/looker/docs/creating-visualizations.md.txt#temporary_hide)
- [Disabling the series by default](https://docs.cloud.google.com/looker/docs/creating-visualizations.md.txt#disable)
Additionally, to hide an individual series completely, you can use a data column [**More** menu](https://docs.cloud.google.com/looker/docs/creating-and-editing-explores.md.txt#using-the-data-column-more-menu) option that is specific to pivoted results, **Hide this column from visualization**, which is described in the next section.
#### Using the data column **More** menu to completely hide a series
You can use the data column [**More** menu](https://docs.cloud.google.com/looker/docs/creating-and-editing-explores.md.txt#using-the-data-column-more-menu) in the data table of an Explore to hide specific columns (series) of data from a pivoted visualization.
To hide a specific column of data from a visualization, follow these steps:
1. Select the column's **More** menu.
2. Choose **Hide this column from visualization**.
Data won't be displayed for any specific column that is hidden, including in the legend. However, the other pivoted columns that share the same underlying measure will still be displayed in the visualization.
#### Using the data column **More** menu to completely hide a field
The data column [**More** menu](https://docs.cloud.google.com/looker/docs/creating-and-editing-explores.md.txt#using-the-data-column-more-menu) also contains the **Hide field from visualization** option for pivoted results, as described in the [Completely hiding a field from the visualization](https://docs.cloud.google.com/looker/docs/creating-visualizations.md.txt#hide) section.
## Filling in missing dates and values
Some datasets have values, such as dates, that follow a predictable pattern. You might pull data by a timeframe and find that some dates, weeks, months, or other date types don't have a corresponding value. By default, the data table will display only the dates that the query returns and skip any missing dates. Looker's **dimension fill** option lets you display the missing dates or other values in the data table and on the corresponding axis of the query's visualization. Dimension fill is particularly useful for queries where many days have no data or null data.
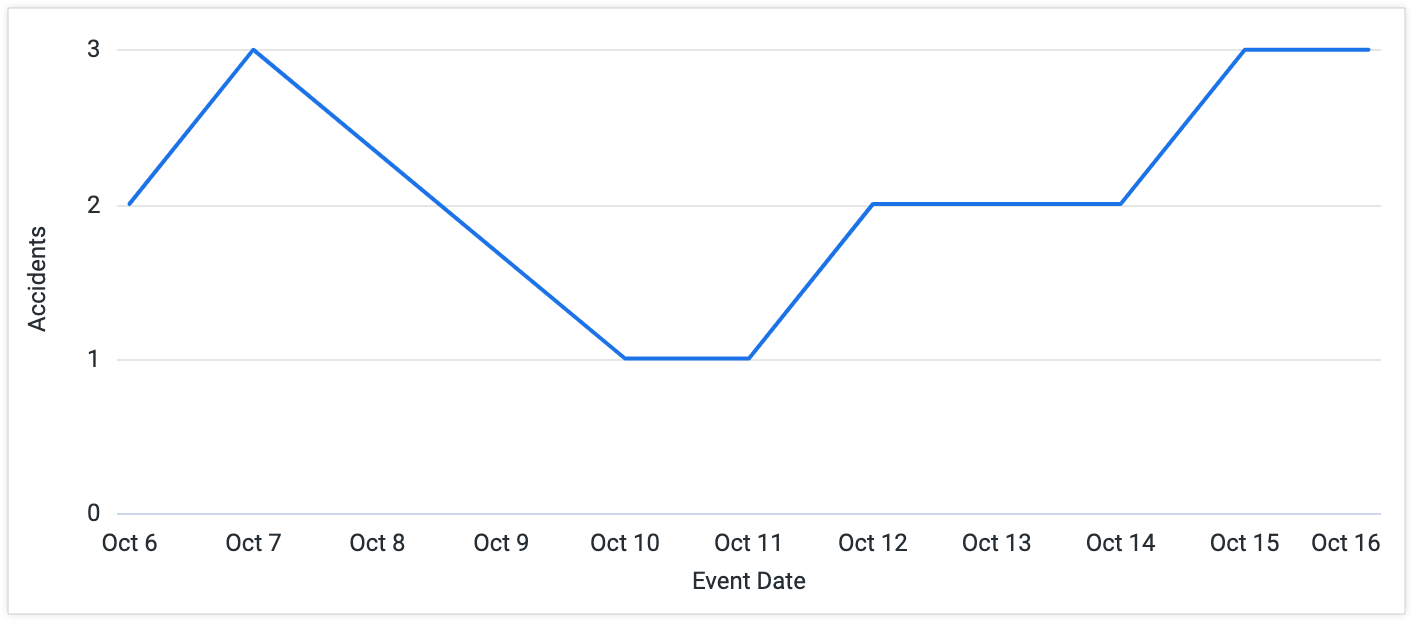
The following data is an example of query results that skip dates with no corresponding value.
| Accidents **Event Date** | Accidents **Count** |
|---|---|
| 2011-10-06 | 2 |
| 2011-10-07 | 3 |
| 2011-10-10 | 1 |
| 2011-10-11 | 1 |
| 2011-10-12 | 2 |
| 2011-10-13 | 2 |
| 2011-10-14 | 2 |
| 2011-10-15 | 3 |
| 2011-10-16 | 3 |
If you don't use dimension fill, Looker connects the data points it has, resulting in a potentially misleading graph that doesn't show the dates for which there is no data. In this example, the graph appears to include values for the dates 2011-10-08 and 2011-10-09 even though these dates have no corresponding values in the data table.
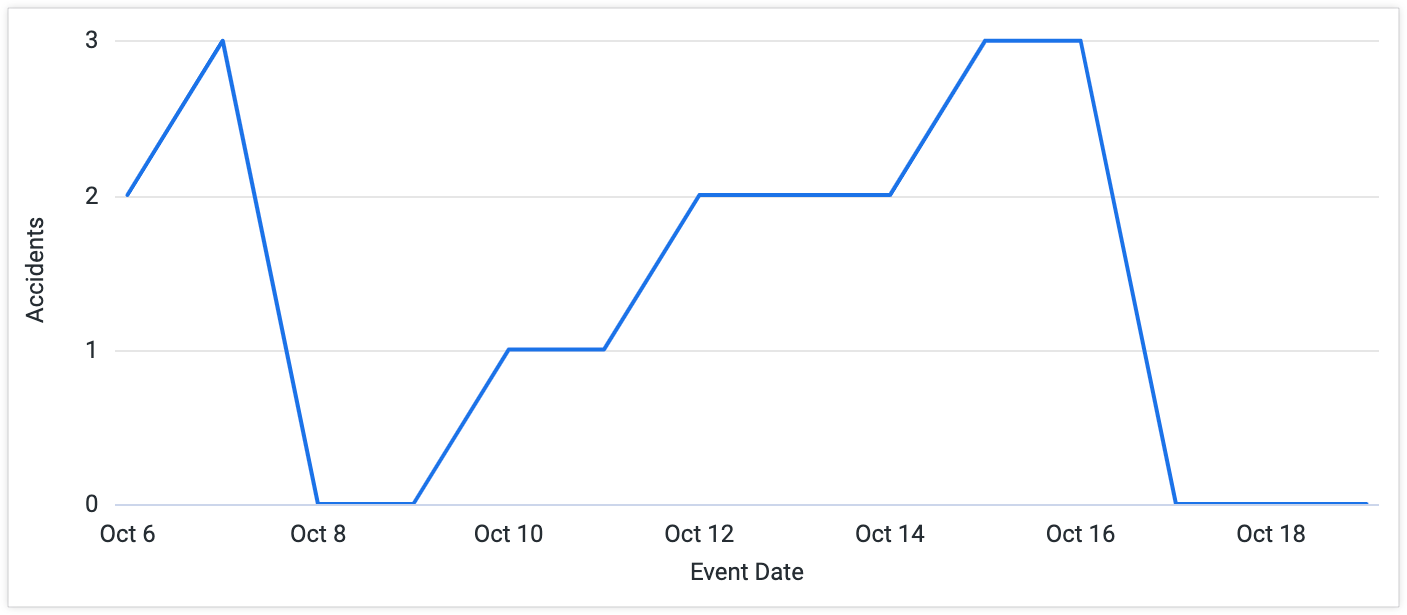
Turning on dimension fill adds the missing dates:
| Date | Value |
|---|---|
| 2011-10-06 | 2 |
| 2011-10-07 | 3 |
| 2011-10-08 | Ø |
| 2011-10-09 | Ø |
| 2011-10-10 | 1 |
| 2011-10-11 | 1 |
| 2011-10-12 | 2 |
| 2011-10-13 | 2 |
| 2011-10-14 | 2 |
| 2011-10-15 | 3 |
| 2011-10-16 | 3 |
| 2011-10-17 | Ø |
| 2011-10-18 | Ø |
In the visualization, dates with null values are plotted as zero. This makes the graph more informative.
To use dimension fill, select a dimension's data column [**More** menu](https://docs.cloud.google.com/looker/docs/creating-and-editing-explores.md.txt#using-the-data-column-more-menu) in the Explore **Data** pane. Choose the **Fill in Missing Dates** or **Fill in Missing Values** option.
Dimension fill is available for dimensions with yes/no values, tiered values, and most date types. It can also be applied to any dimension based on a list of values, using the [`case`](https://docs.cloud.google.com/looker/docs/reference/param-field-case.md.txt) or [`tier`](https://docs.cloud.google.com/looker/docs/reference/param-dimension-filter-parameter-types.md.txt#tier) parameters.
Dimension fill turns on automatically for queries that run with a single dimension and/or a single [pivot](https://docs.cloud.google.com/looker/docs/creating-and-editing-explores.md.txt#pivoting_data), as long as you haven't applied filters to any measures. Dimension fill can also be applied to multiple dimensions at once in a query --- including pivoted dimensions --- however, Looker may automatically disable dimension fill to optimize query performance if it detects that too many fields will be generated with filled values.
You cannot use dimension fill in certain cases, such as the following:
- When your Looker developer used the [`order_by_field`](https://docs.cloud.google.com/looker/docs/reference/param-field-order-by-field.md.txt) parameter or disabled the [`allow_fill`](https://docs.cloud.google.com/looker/docs/reference/param-field-allow-fill.md.txt) parameter on certain dimensions.
- When dimensions have a filter applied to them and also have a fixed number of values, such as yes/no, days of the week, days of the month, etc. Filtering against these field types eliminates the values that Looker needs to predictably and accurately fill in any missing values.
- When you are [drilling](https://docs.cloud.google.com/looker/docs/viewing-looks.md.txt#drilling_into_a_looks_visualization) into a [pivoted](https://docs.cloud.google.com/looker/docs/creating-and-editing-explores.md.txt#pivoting-data) dimension.
- When Looker detects that too many rows or columns will be generated with filled values and automatically disables dimension fill to optimize query performance.
## Using the Visualization Assistant
The [Visualization Assistant](https://docs.cloud.google.com/looker/docs/custom-looker-visualization-gemini.md.txt) lets you customize a Looker visualization by using Gemini in Looker. The Visualization Assistant includes an updated conversational panel that supports multi-turn chats, displaying compact visualization renderings at each turn, letting you iterate on your visualization customizations.
To customize a visualization with the **Visualization Assistant**, follow these steps:
1. When viewing a visualization in an Explore, click the **Style** tab.
2. Click **Visualization Assistant** to open the prompt window.
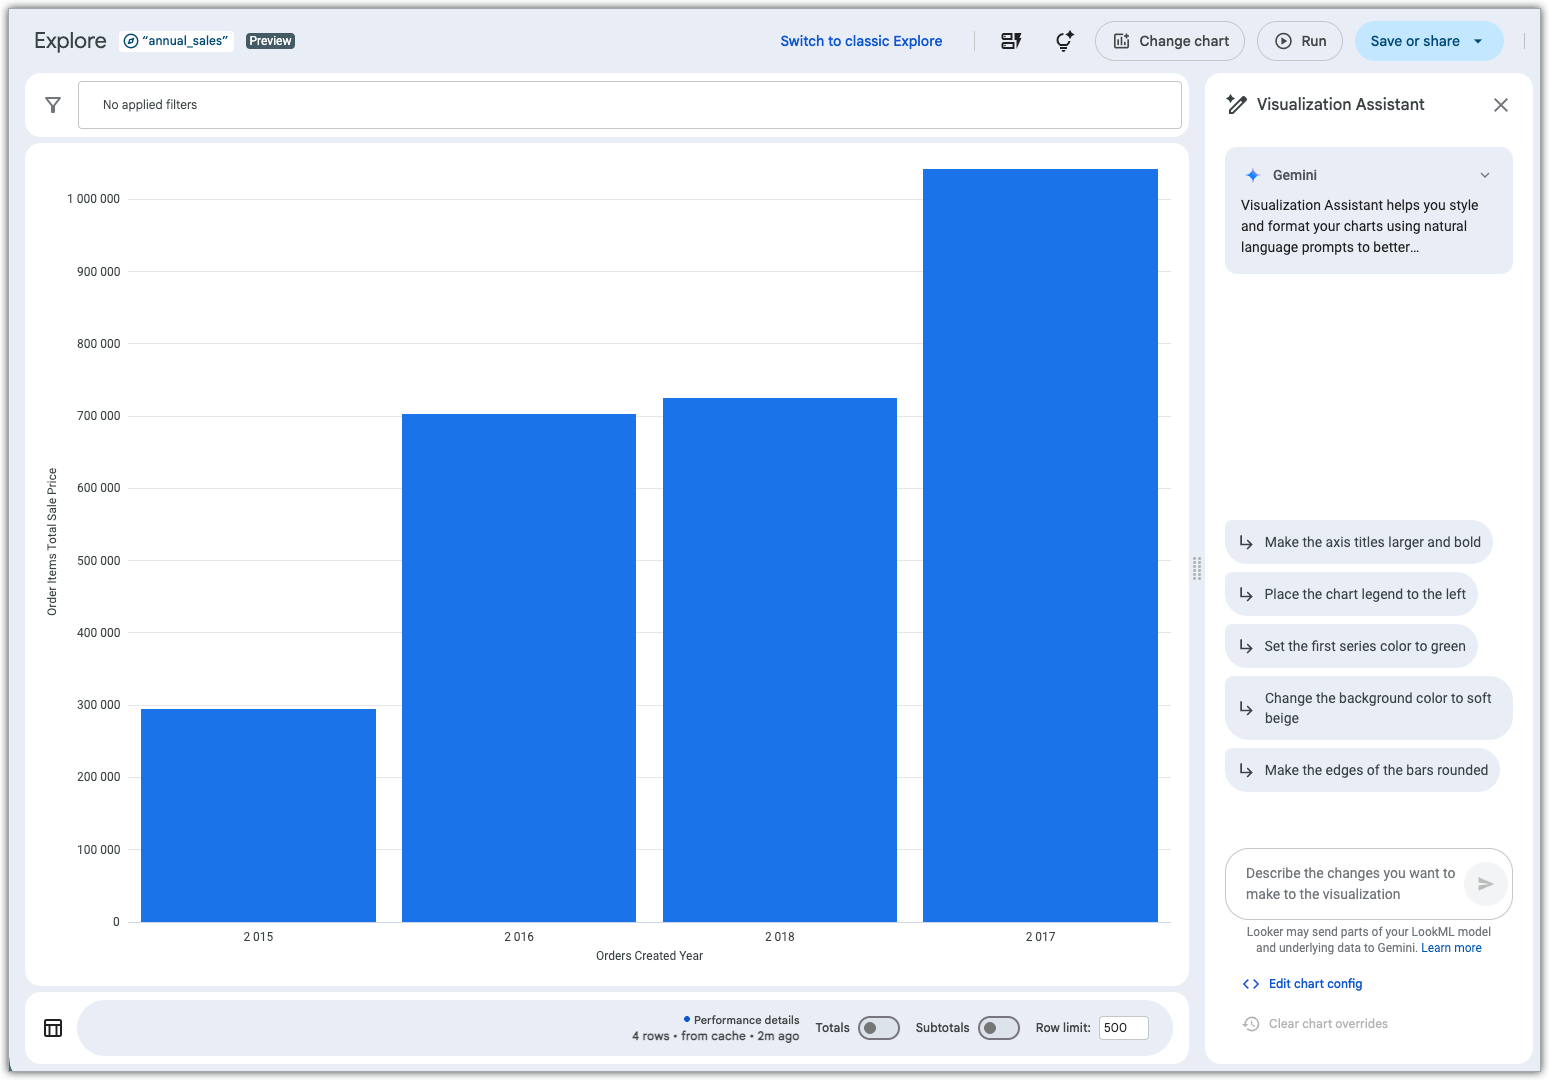
3. In the Visualization Assistant prompt field, describe any changes that you want to make to the visualization.
For more information about using the Visualization Assistant, see the [Create visualizations with Gemini assistance](https://docs.cloud.google.com/looker/docs/custom-looker-visualization-gemini.md.txt) documentation page.
## The visualization tooltip
When you hover over a datapoint in a visualization, the tooltip displays the value of the selected dimensions and measures by default.

You can use the **Custom Tooltip** setting in the **Style** tab to configure tooltips within the [Explore visualization editor](https://docs.cloud.google.com/looker/docs/creating-visualizations.md.txt#quick_guide) by using a combination of UI settings and an HTML editor that supports Liquid templating. [Learn more about custom tooltips](https://docs.cloud.google.com/looker/docs/custom-tooltips.md.txt).